Working with Data in the Strivr Portal
Generating raw data
After the Strivr SDK is fully implemented and you have tagged events in your project with the necessary code, you need to generate raw data to send to the linked project in the Strivr Portal. First, make sure you are logged in to Strivr in Strivr > Project Settings. Then enter play-mode in the Unity console to send raw data to the linked project in the Strivr Portal. You can also send data to the linked project by putting on the headset and going through your project from beginning to end.
|
Make sure Test Mode is enabled in your Unity project settings. If Test Mode is off, no data will be transferred to the linked project in the Strivr Portal. If you wish to test your project within the Unity editor, make sure that Test Mode is enabled and that you are signed in within the Strivr window. 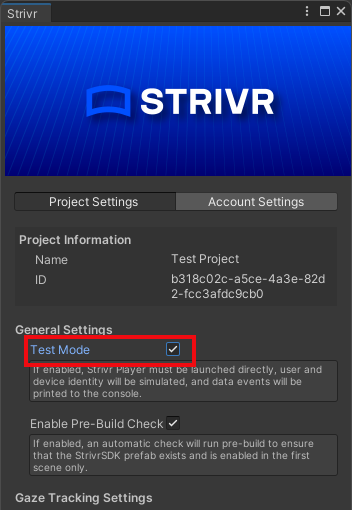
|
Viewing raw data in the Strivr Portal
When you go through your project in the headset, data from each tagged event is sent to the Strivr Portal.
-
Log into the Strivr Portal at portal.strivr.com.
-
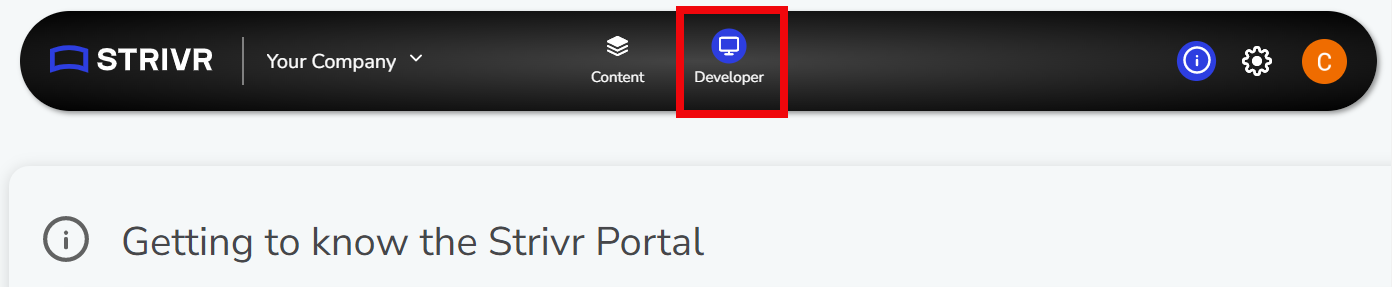
In the top menu, click Developer to open the Developer Dashboard.
-
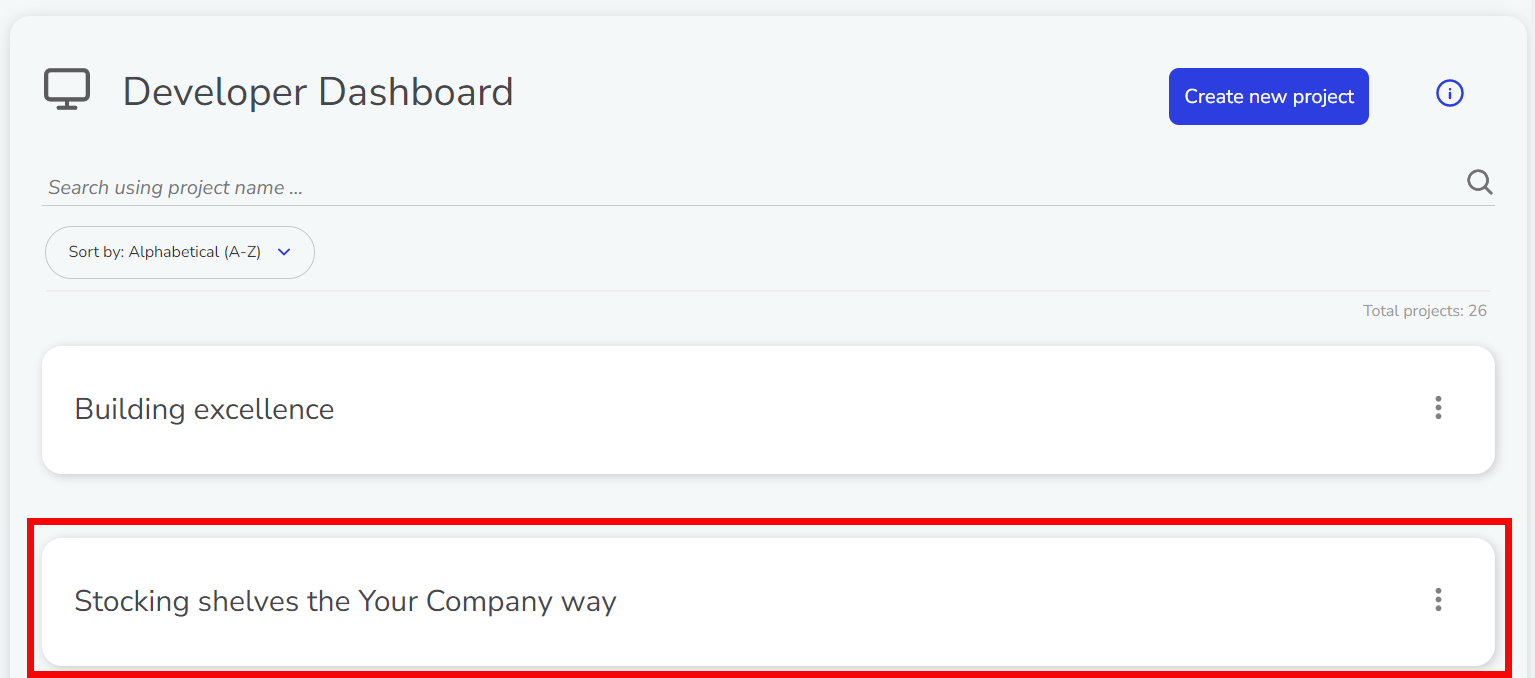
Select your project from the list.
-
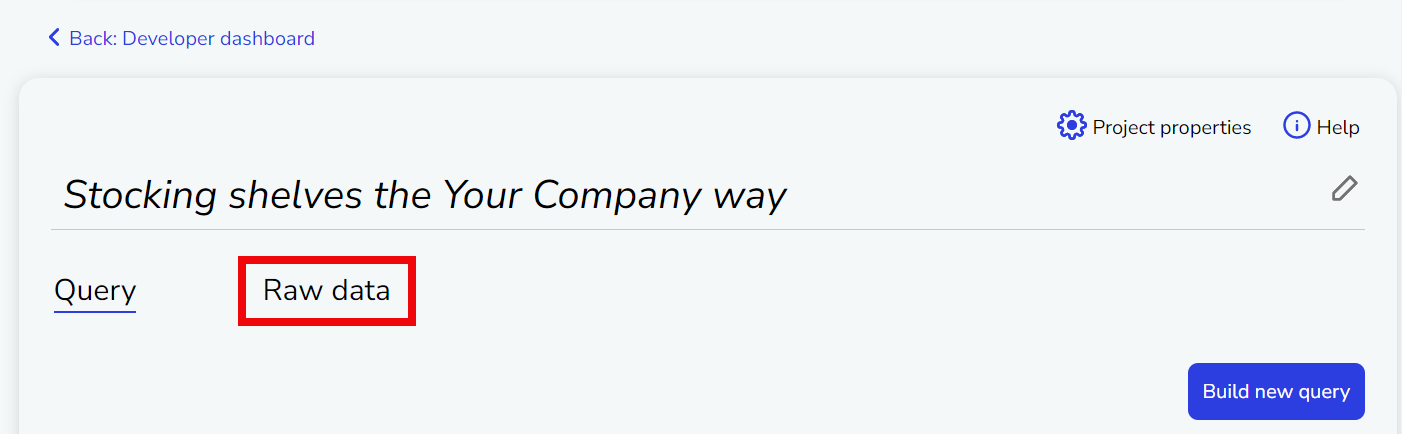
Click the Raw Data tab.
-
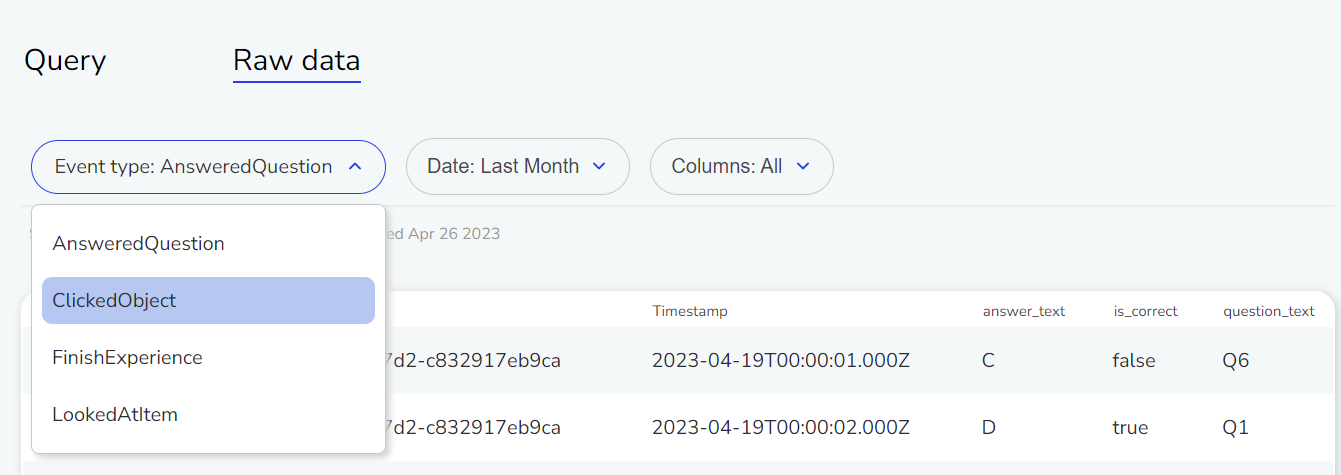
Use the drop-down menu to select an Event Type.
-
You can filter the raw data by Event Type and by Date, and choose to display or hide columns.
| After columns Login ID, Device ID, and Timestamp, each column is an added parameter for a tracked event. To learn more about tracking events, see How to Track Events. |
Building queries in the Strivr Portal
After raw data is available in the Strivr Portal, you can build and save queries users can select to view charts and graphs.
-
In the Developer Dashboard, select your project from the list.
-
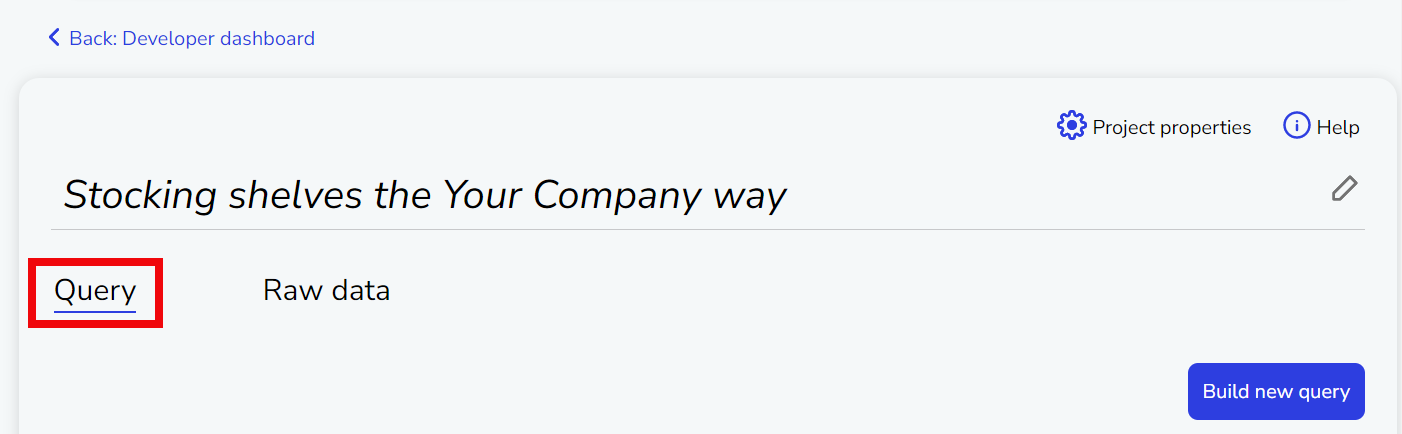
Click the Query tab.
-
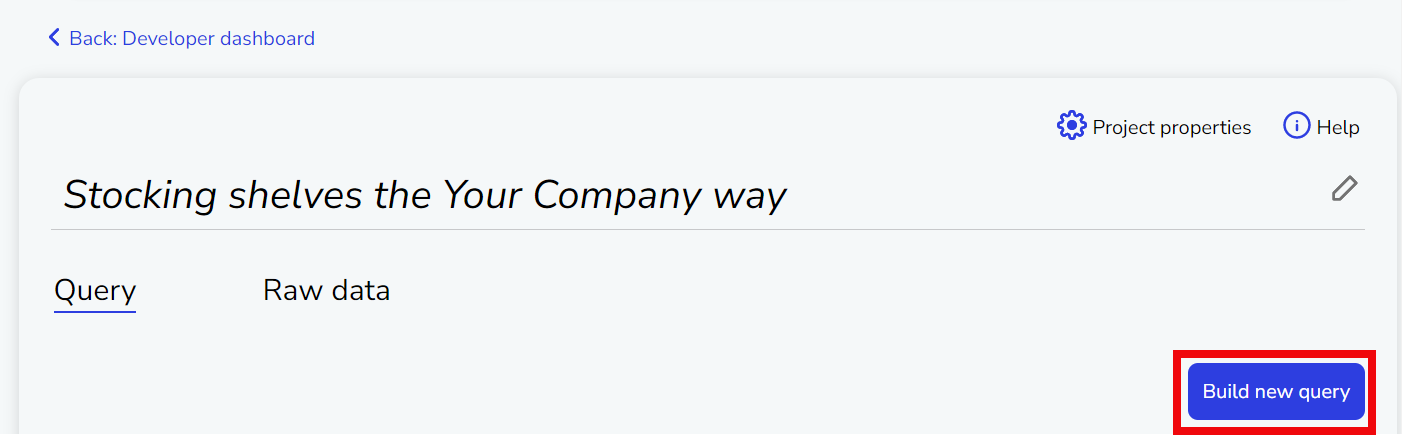
Click Build new query
-
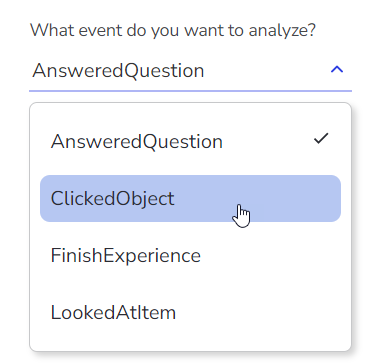
Select an event type
-
If desired, choose how to aggregate the events. Aggregation determines what information the visualization will display. Click the plus icon to choose from a list. If you want to add another level of aggregation. click the plus icon again. Remove a level of aggregation with the trash can icon.
Available aggregation options depend on the value selected in Event Type. 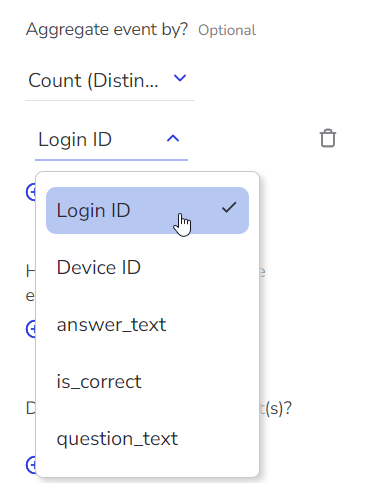
-
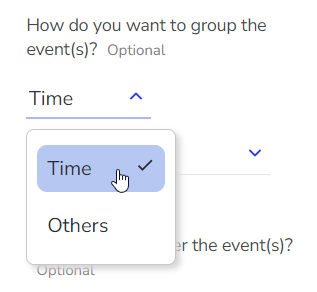
If desired, choose how to group the events (either by time or by other fields). Click the plus icon to choose from a list. The default grouping is by time, but you can select Others in the first drop-down to choose another column. Remove a grouping with the trash can icon.
-
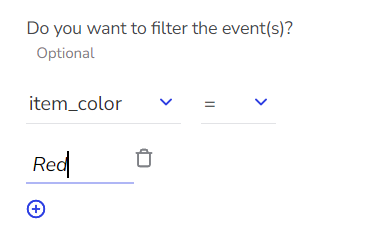
If desired, choose how to filter the events. Click the plus icon to define a filtering criteria. For example, to only show results for clicked items that are red, set item_color = Red.
-
Click Generate result. The tabular data displays on the right side of the window.
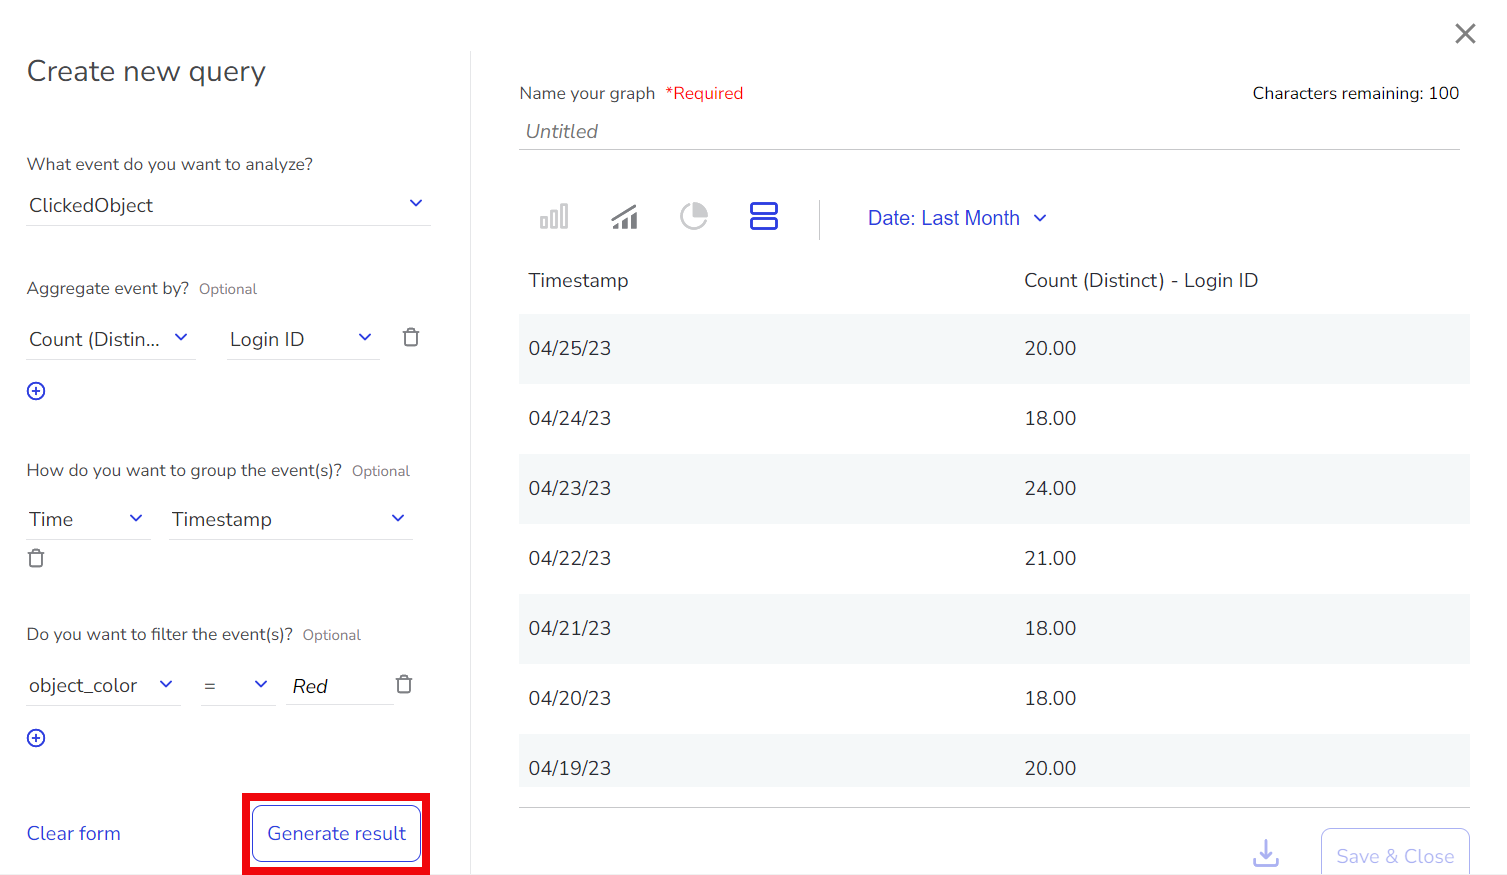
-
Click the icons above the graph or chart to switch to a different type of data visualization and use the drop-down to select a date range.
Available visualizations depend on selections for the query. Visualization Aggregation Grouping Line graph
At least 1 field
Timestamp only
Bar chart
At least 1 field
No timestamp; 1 other field
Pie chart
Only 1 field
No timestamp; 1 other field
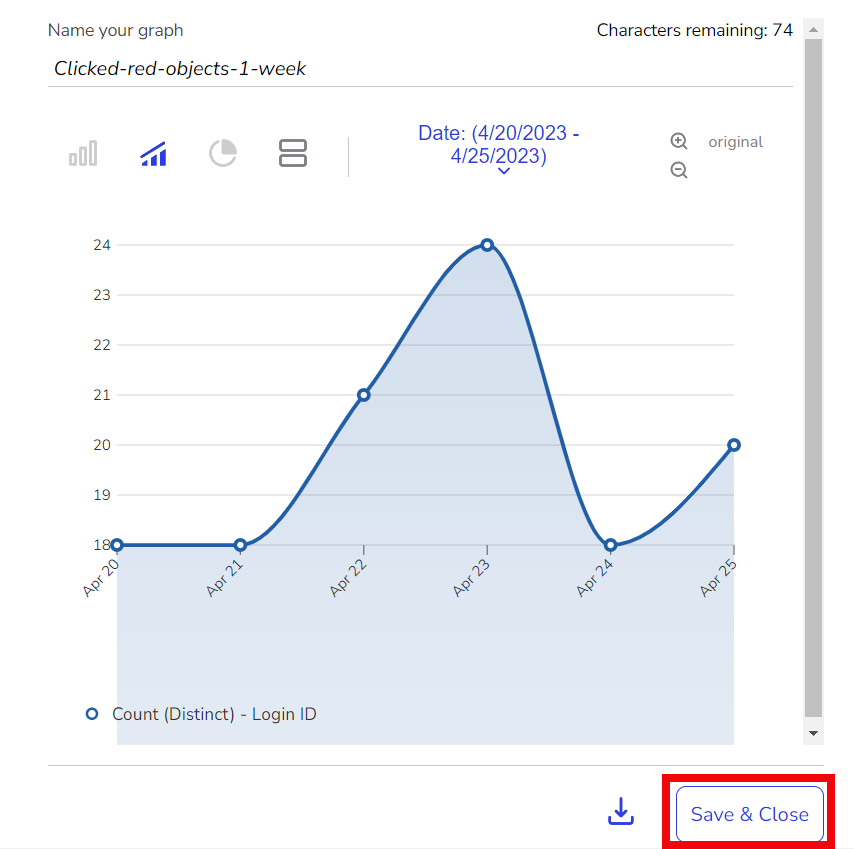
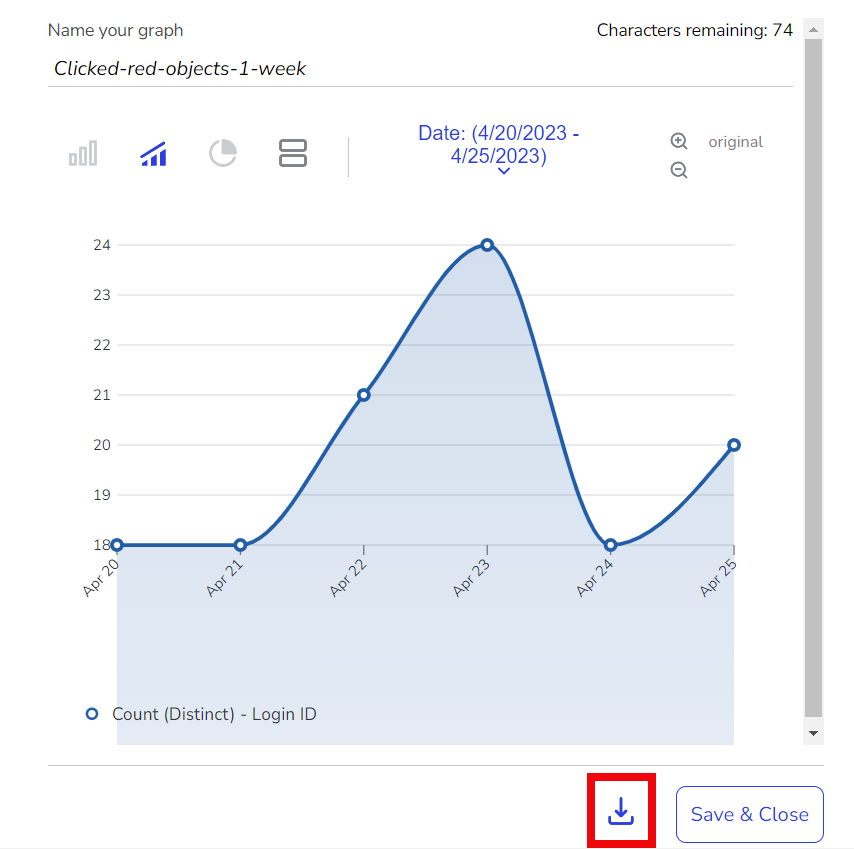
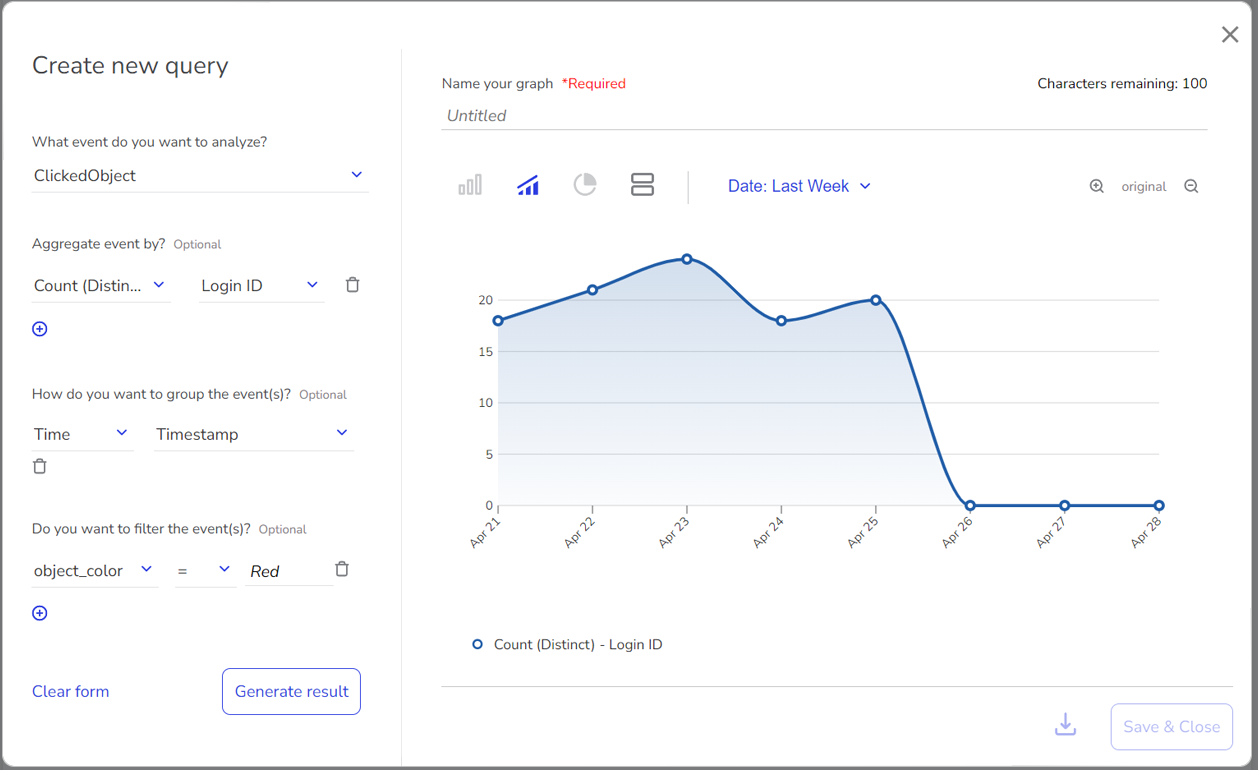 Line graph showing number of users that clicked a red object in the last week
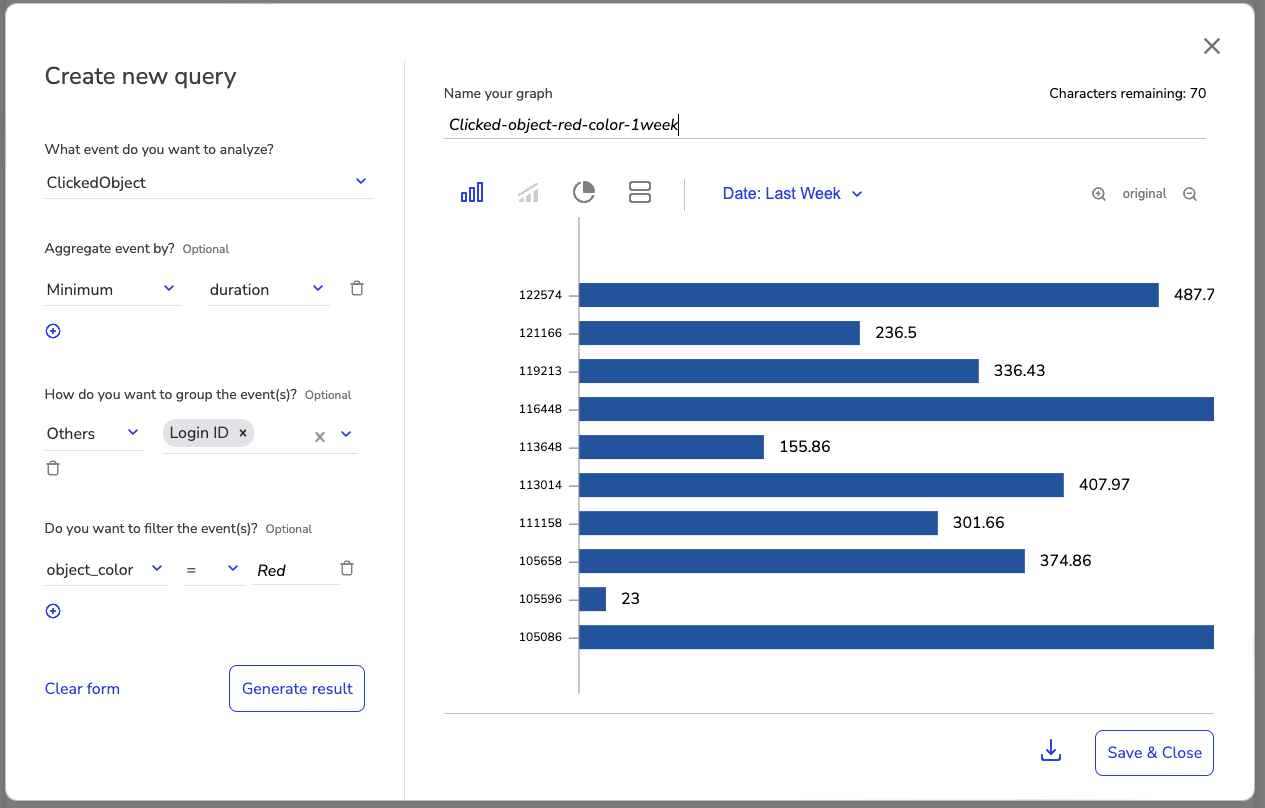 Bar chart showing minimum session duration of users that clicked a red object in the last week
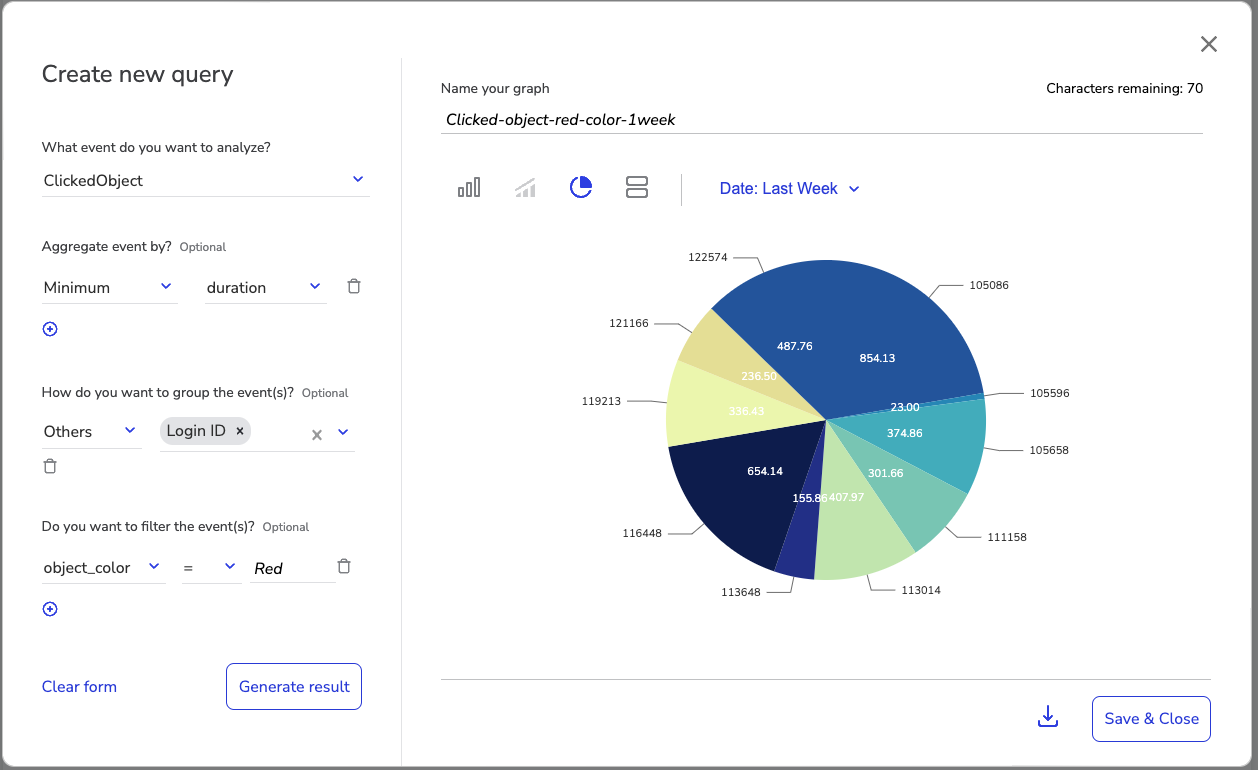 Pie Chart showing minimum session duration of users that clicked a red object in the last week
 -
To download a PNG (for graphs) or CSV file (for tabular data) of the data, click the download icon below the visualization.
-
To save a query and make it available within the Query tab of the Developer section for your company, click Save & Close.